Odds vs. Win Probability: What’s the Difference?
Betting odds and win probability sound like they should mean the same thing, but they come from different sources and serve different purposes.
- Betting odds are a commercial price set by a bookmaker. They’re built on statistical analysis, but also on market forces, how much money is being wagered on each side, and they always include a built-in margin so the bookmaker profits regardless of outcome.
- Win probability is a statistical estimate of how likely an outcome actually is, typically generated by models using historical data, current match conditions, and (in live settings) the current game state.
In short: odds are a price, and win probability is an estimate. They’re related, odds are meant to approximate probability, but they are not the same number, and understanding why they diverge is the whole point of comparing them.
Step 1: Converting Odds Into Implied Probability
Before comparing odds to a win probability model, you need to convert the odds themselves into a percentage, known as implied probability.
- Decimal odds: Implied Probability = 1 ÷ Decimal Odds Example: Odds of 1.75 → 1 ÷ 1.75 = 0.571 → 57.1%
- Fractional odds: Implied Probability = Denominator ÷ (Denominator + Numerator) Example: 4/6 → 6 ÷ (6+4) = 0.60 → 60%
- Moneyline odds:
- Negative: (−Odds) ÷ ((−Odds) + 100)
- Positive: 100 ÷ (Odds + 100)
This implied probability is your starting point, it’s what the betting market is effectively saying about an outcome’s likelihood, before you compare it against an independent estimate.
Step 2: Understanding How “True” Win Probability Is Estimated
Independent win probability, the number you compare odds against, usually comes from one of a few sources:
- Statistical models built on historical team and player performance, adjusted for venue, conditions, and current form.
- Simulation-based models, which run a match scenario thousands of times (a Monte Carlo approach) using ball-by-ball scoring probabilities to generate a distribution of outcomes.
- Live win probability trackers, used by broadcasters and analytics platforms, which recalculate probability continuously based on the current score, wickets in hand, required run rate, and historical data from similar match situations.
It’s worth being clear-eyed here: none of these produce a “true” probability in an absolute sense, they produce a modeled estimate, with its own assumptions and margin of error. But because these models aren’t built to generate a profit margin the way bookmaker odds are, they offer a useful independent reference point.
Step 3: Removing the Bookmaker’s Margin for a Fair Comparison
If you convert every outcome in a market to implied probability and add them up, the total is almost always slightly above 100%. This excess, called the overround, vig, or bookmaker’s margin — needs to be removed before comparing odds to a win probability model, or you’ll be comparing an inflated number to a fair one.
To remove the margin (a simple proportional method):
- Calculate implied probability for every outcome in the market.
- Sum them to get the total (e.g., 106%).
- Divide each individual implied probability by this total to “normalize” it back to 100%.
Example: If Team A is 58% and Team B is 48% (totaling 106%), Team A’s margin-free probability becomes 58 ÷ 106 = 54.7%, and Team B’s becomes 48 ÷ 106 = 45.3%, now totaling exactly 100%.
This normalized figure is the fairest number to compare directly against an independent win probability estimate.
A Worked Walkthrough: Comparing Odds to Win Probability
Let’s put it all together with a practical example.
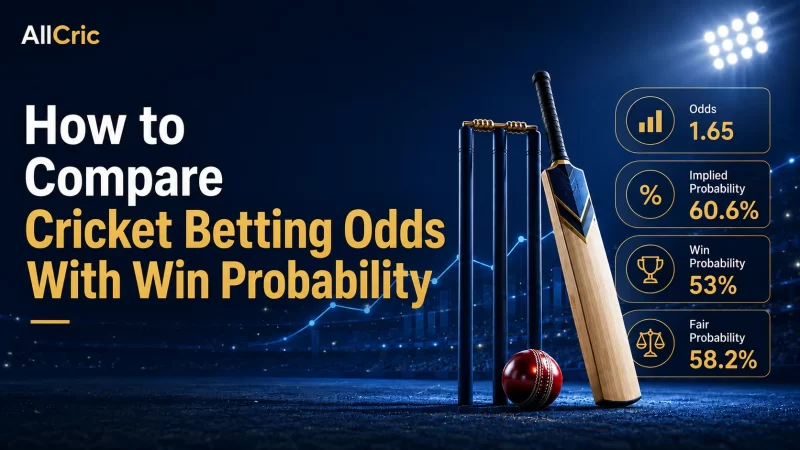
Scenario: Team A is priced at decimal odds of 1.65 to win; Team B is priced at 2.30.
1. Convert to implied probability:
- Team A: 1 ÷ 1.65 = 60.6%
- Team B: 1 ÷ 2.30 = 43.5%
- Total: 104.1% (a margin of roughly 4.1%)
2. Remove the margin:
- Team A: 60.6 ÷ 104.1 = 58.2%
- Team B: 43.5 ÷ 104.1 = 41.8%
3. Compare to an independent win probability model, which might estimate Team A’s true win probability at 53% based on recent form, venue history, and matchup data.
- Interpret the gap: The market’s margin-free implied probability for Team A (58.2%) is higher than the model’s estimate (53%), a roughly 5-point gap. This tells you the market is somewhat more confident in Team A than the statistical model is, which could stem from information the model doesn’t capture (like momentum or team news) or simply a difference in methodology.
This step-by-step comparison, convert, normalize, then compare, is the practical core of any odds vs win probability cricket analysis.
Why the Two Numbers Rarely Match Exactly
Even with the margin removed, odds and independent win probability estimates rarely align perfectly, for several reasons:
- Different information sets: The market incorporates real-time information (like a late team news leak) that a model trained on historical data may not yet reflect.
- Model assumptions: Every win probability model makes simplifying assumptions, about form weighting, venue effects, or how to treat rain-affected matches, that can diverge from how the market prices the same factors.
- Public sentiment and money flow: Odds are also shaped by where money is actually being placed, which can reflect popular bias (e.g., overvaluing a well-known team) rather than pure statistical probability.
- Sample size and recency: Statistical models can be highly sensitive to how much recent data they weigh, while markets tend to react more fluidly to the very latest news.
What a Gap Between Odds and Win Probability Can Tell You
The size and direction of the gap between margin-free implied probability and an independent model’s estimate is informative in itself:
- Market probability higher than model probability: Suggests the market may be factoring in something the model isn’t (team news, momentum), or that public money is skewing the price.
- Model probability higher than market probability: Suggests the model sees statistical value the market hasn’t fully priced in yet, which is the basis of most “value betting” theory (though it doesn’t guarantee the model is right).
- Numbers closely aligned: Suggests both the market and the model are working from similar information and assumptions, a sign of a well-priced, “efficient” market for that outcome.
None of this tells you which number is “correct”, only where the disagreement lies, which is valuable context in itself.
Live Win Probability vs. Live Odds: Reading In-Play Markets
The same comparison framework applies during a live match, where both live odds and live win probability trackers update continuously:
- Live win probability models react to the current score, wickets in hand, and required run rate using historical data from similar match situations.
- Live odds react to the same in-game events, but also to the volume and direction of in-play betting activity.
Because both update quickly, comparing them in real time can highlight moments where the market may be over- or under-reacting to a recent event (like a boundary or a wicket), compared to what historical data suggests that event should mean statistically.
Common Mistakes When Comparing Odds and Probability
- Forgetting to remove the bookmaker’s margin, which skews any comparison toward the market looking more “confident” than it actually is.
- Treating a win probability model as ground truth, when it’s really just another estimate with its own assumptions.
- Ignoring sample size, especially for less-covered matches (domestic cricket, associate nations) where both odds and models are working from thinner data.
- Comparing pre-match odds to live win probability (or vice versa) without accounting for the fact that conditions have changed since the odds were last set.
- Overreacting to small gaps, which may simply reflect normal modeling variance rather than a meaningful signal.
How AllCric Brings Odds and Win Probability Context Together
Comparing odds to win probability is only useful if you have reliable, up-to-date inputs for both sides of the equation. AllCric consolidates the data that both odds and win probability models are built on, live scores, ball-by-ball updates, team form, head-to-head records, venue and pitch history, and player statistics, all in one place.
This matters in practice: instead of trying to compare a bookmaker’s price against a probability figure with no context for why either number is what it is, AllCric lets you see the underlying match data, recent form, toss impact, conditions, that explains the gap.
Conclusion
Comparing cricket betting odds with win probability isn’t about finding a magic formula that guarantees profit, it’s about understanding what each number is actually telling you and where they diverge. By converting odds into implied probability, removing the bookmaker’s margin, and comparing the result against an independent win probability estimate, you get a clearer, more critical read on any cricket market. The gap between the two numbers won’t tell you the future, but it will tell you where the market’s confidence and a statistical model’s confidence disagree — which is exactly the kind of insight that turns passive odds-watching into genuinely informed analysis.



 Get expert Today cricket match predictions 100 sure, top picks & fantasy tips – Download AllCric App or visit AllCric Website