
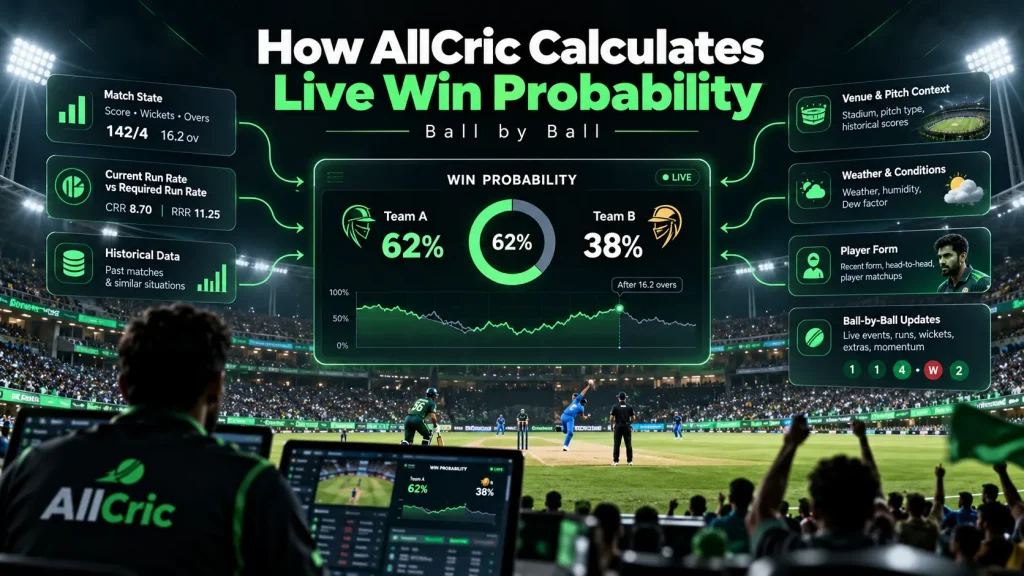
How AllCric Calculates Live Win Probability, Ball by Ball
Live win probability can move fast after a wicket, boundary or even a few dot balls. AllCric reads the live score, wickets, overs, target and match conditions, then updates each team’s chances as the game changes.
Summary
How win probability is calculated is one of the most common questions cricket fans ask about AI tools. This guide explains it in three layers: how win probability models work in cricket in general, what AllCric has publicly said about the data and approach behind its AI Win Probability, and what has not been published. In short, a live win probability model starts from the match state (score, wickets, overs and target), compares it with how similar situations played out historically, adjusts for context such as pitch, venue and form, and refreshes as new data arrives. AllCric describes its models as cricket-specific machine learning built on historical, player, venue, conditions and live in-match data. Exact model type, weightings and refresh logic are not public, so this article keeps to what can be verified.
Why People Ask How Win Probability Is Calculated
A percentage on screen looks authoritative. When a team moves from 62% to 41% after one wicket, fans want to know why, and whether the number deserves their trust.
The honest answer has two parts. The general method behind a win probability model in cricket is well understood and widely discussed. The specific recipe behind any one app, including AllCric, is proprietary and only partly disclosed. A trustworthy explanation has to separate the two.
This guide does that. It explains the general approach, then lays out what AllCric, a live cricket score, prediction and fantasy app, has said about its AI Win Probability, which sits within a set of live outputs it calls AI Markets. It also flags clearly what is not public, so you can read the numbers with the right expectations.
What Win Probability Actually Measures
Win probability is an estimate of how likely each team is to win from the current match situation. It is expressed as a percentage and updated as the match changes.
- It is conditional. The number answers the question: given what has happened so far, how often would a team in this position win?
- It is not a forecast of one specific outcome. A 70% estimate still loses about three times in ten.
- It changes with information. Each wicket, boundary or dot ball adds information, so the number moves.
- It depends on format. The same score means different things in T20, ODI and Test cricket.
The Core Building Blocks of a Win Probability Model in Cricket
Most cricket win probability approaches, whatever the tool, are built from a similar set of ingredients. The table below summarises them as general concepts, not as a description of any single product.
|
Building block |
What it captures |
Why it matters |
|
Match state |
Score, wickets lost, overs or balls bowled, and the target in a chase |
The core description of where the match stands |
|
Resources remaining |
Overs left and wickets in hand |
Together they define how much batting potential is left |
|
Run rates |
Current rate against the required rate |
Shows whether the pace is ahead of or behind what is needed |
|
Historical outcomes |
How similar situations ended in past matches |
Turns a situation into a likelihood |
|
Context adjustments |
Venue, pitch behaviour, conditions and team strength |
Adjusts the baseline for this particular match |
|
Player information |
Who is batting, who is bowling, and recent form |
Refines the read beyond team totals |
Two broad families of method are common in the public discussion of cricket models. One compares the live situation with a large set of historical matches and reads off how often teams in that position won. The other uses machine learning to learn patterns from past data and score new situations. Many practical systems combine ideas from both.
How Live Updates Work, Ball by Ball
The phrase ball by ball probability describes how the number refreshes as play unfolds. The process is simple in principle:
- A new event arrives. A run, a wicket, an extra or a dot ball changes the match state.
- The model recalculates. It recomputes the likelihood using the updated state and any new context.
- The number is displayed. The app refreshes the figure and, in AllCric’s case, shows when each module was last updated.
- The cycle repeats. The next event triggers another update.
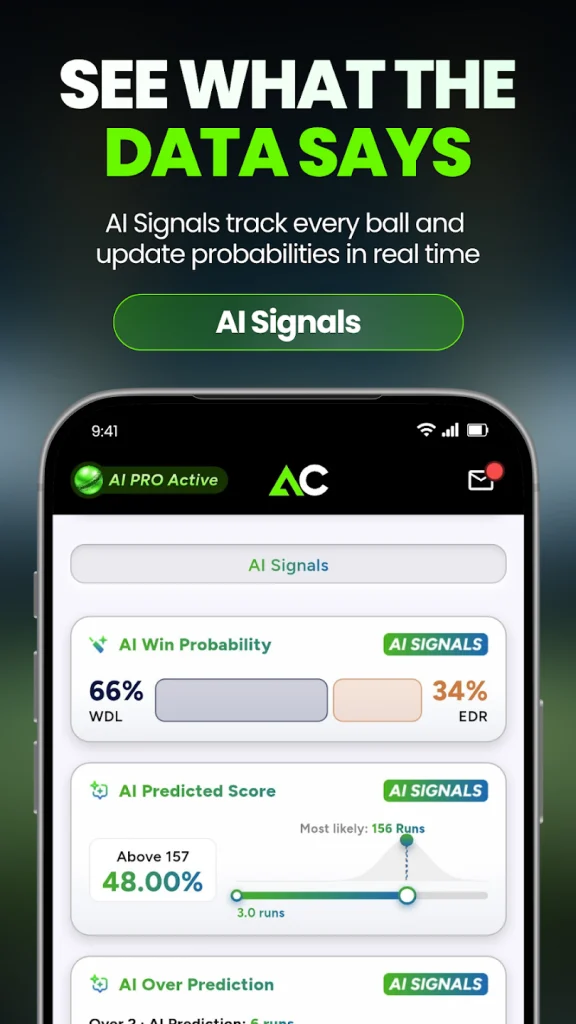
There is a practical point worth knowing. In AllCric’s AI Signals screens, each module carries an “Updated” timestamp, and in the screenshots we reviewed, those timestamps read in the range of tens of seconds. That is a reminder that displayed reads are refreshed on a cycle, so it is wise to check the timestamp when a match is moving fast, rather than assume every figure reflects the last delivery.
What AllCric Says About Its Data and Approach
AllCric’s published materials describe its approach in broad terms. According to a press release distributed in October 2026, the platform uses machine learning models that draw on several data streams at once. Based on that description, the inputs are:
- Historical match data across tournaments and formats
- Player career statistics across formats
- Pitch and surface behaviour
- Venue-specific scoring patterns
- Weather and atmospheric conditions
- Head-to-head matchup records
- Live in-match inputs
The same materials say the models are cricket-specific, meaning trained on cricket data and calibrated for cricket contexts, rather than general-purpose models applied to sport. They describe the outputs as probability-weighted: win probability, predicted score ranges, player impact rankings and over-by-over and session predictions that update as the match evolves.
AllCric groups its live outputs under the name AI Markets, which it lists as AI Win Probability, Predicted Score Range, Over Prediction, Session Prediction and Top Player Impact. The company describes these as tracking momentum shifts ball by ball.
In the app itself, the AI Signals tab shows several of these modules, each with an information panel. The in-app descriptions are consistent with the above: the predicted score is described as based on run rate and wickets, the over prediction as based on form and pitch conditions, and the session prediction as based on run rate and wickets.
Note that this press material was issued by the company through a PR arrangement, so it should be read as AllCric’s own description rather than an independent audit.
A Worked Example: The Match State Behind the Number
Here is a concrete case from AllCric’s AI Signals screen in an ICC CWC League 2 match. Canada made 256 in 50 overs. Oman, chasing 257, were 49 for 2 after 6.3 overs, with a current run rate of 7.54 and a required run rate of 4.78.
|
Input |
Value |
|
Target |
257 |
|
Runs scored |
49 |
|
Runs needed |
208 |
|
Wickets lost |
2 |
|
Wickets in hand |
8 |
|
Overs bowled |
6.3 |
|
Overs left |
43.3 |
|
Current run rate |
7.54 |
|
Required run rate |
4.78 |
These are the raw ingredients any model would start from. A model then asks how often chasing teams in a similar position have won, and adjusts for factors such as the venue, the pitch and the strength of the batting still to come. The same card set also showed an AI predicted score of 262.0 runs against the 257 target, which points the same way as the run-rate picture.
This example illustrates the inputs. It does not reveal the model’s output or method, and we do not claim a specific win probability figure for this moment.
How Context Adjusts the Baseline
Two matches with the same score can have different probabilities, because context shifts the baseline. Based on AllCric’s description of its inputs, these are the kinds of adjustments in play:
- Venue and pitch. A ground where 280 is routine treats a 257 target differently from one where 220 is a good score.
- Conditions. Weather and atmospheric conditions can change how many runs are realistic.
- Matchups. Head-to-head records and player strengths can tilt a close situation.
- Form. Recent performance can refine how much credit a team or player gets.
- Live inputs. The in-match state overrides pre-match expectations as play proceeds.
The practical lesson is that win probability combines a general baseline with match-specific context. That is why reading it next to the scoreboard and your own knowledge of the game gives the best result.
Win Probability vs Live Odds Calculation: Not the Same Thing
Searches for live odds calculation often blur two separate ideas. Win probability is a statistical estimate of how a match may unfold. Betting odds are prices set by bookmakers, which include margins and reflect market demand.
|
Win probability |
Betting odds |
|
|
What it is |
A model’s estimate of each team’s chance |
A price set to attract and balance wagers |
|
Includes a bookmaker margin |
No |
Yes |
|
Main purpose |
Understanding the match |
Setting terms for a wager |
AllCric presents its AI outputs as insights and probabilities for fans and skill-based fantasy players. Use them to understand the game, and play within limits you are comfortable with.
How to Judge a Win Probability Number Critically
A sensible reader treats any model output with a few questions in mind:
- Is the number recent? Check the update time before reacting.
- Does it match the match state? Compare it with the score, wickets, overs and run rates.
- Is the move explained? After a big swing, ask what event caused it. AllCric’s Ask AI bar bar lets you ask match-specific questions in plain language.
- Does it agree with other signals? Compare it with predicted score, over and session reads.
- Are you reading the trend? A steady drift tells you more than a single reading.
- Are you treating it as a guarantee? It is a likelihood, and upsets are part of cricket.
Final Thoughts: Know What the Number Is Made Of
The most useful way to think about how win probability is calculated is as a chain: match state, historical comparison, context adjustment and live refresh. AllCric describes a cricket-specific machine learning approach built on historical, player, venue, conditions and live data, and it surfaces the results through AI Markets and the AI Signals tab. What it has not published is the fine detail of the model.
That is fine, as long as you read the numbers with open eyes. Check the timestamp, compare the figure with the scoreboard, watch the trend and use Ask AI to understand the swings. Do that, and the number becomes what it should be: a clear, quick second opinion on a match that is still very much alive.
FAQS
Generally, a model takes the match state, such as score, wickets, overs and target, compares it with how similar situations ended historically, adjusts for context such as venue and conditions, and updates as new events arrive.
Its published materials list historical match data, player career statistics, pitch and surface behaviour, venue scoring patterns, weather conditions, head-to-head records and live in-match inputs.
Its materials describe AI Markets as tracking momentum shifts ball by ball. In the app, each module shows an update time, so check it to see how fresh a reading is.
The specific model type and weightings are not publicly disclosed.
No. Win probability is a model estimate. Odds are bookmaker prices that include margins.
Yes. It is a likelihood, and cricket is volatile. A 70% estimate loses about three times in ten.