
How to Read Live Win Probability in a Cricket Match
Learn how to read live cricket win probability, why it changes with wickets and run rates, and what the numbers really mean during a match.
Summary
Live win probability cricket models turn the state of a match into one number: the estimated chance each team has of winning right now. It moves with every wicket, boundary and dot ball, which makes it a quick way to see momentum without doing mental maths. This guide explains win probability in plain terms, shows how to read it next to the score, run rates and target, walks through a worked example from a real chase, and lists the mistakes to avoid. It also covers where AllCric’s AI Signals fit in. The main point: win probability is an estimate of likelihood, not a prediction of the result, and it is most useful when you read it together with context.
Why Win Probability Changes How You Watch Cricket
A scoreboard tells you what has happened. It does not tell you who is winning. Is 49 for 2 after 6.3 overs good for a team chasing 257? What about 120 for 4 after 20? Experienced fans answer by feel, weighing wickets in hand, overs left, the pitch and the batting line-up still to come.
Live win probability cricket tools try to put numbers on that feel. They estimate, at any moment, how likely each side is to win, and update the estimate as the match moves. Used well, the number helps you spot turning points as they happen, follow a chase more closely and make sense of why a match feels tense when the required rate looks easy.
This guide shows you how to read it properly. It uses AllCric, a live cricket score, prediction and fantasy app, as the reference point for how AI-driven match reads are presented to fans.
Win Probability Explained: What the Number Means
Win probability is the model’s estimate, expressed as a percentage, of the chance that a team wins from the current match situation. If a team shows 70%, the model sees that team winning in roughly seven out of ten similar situations. The other side has the remaining 30%, or a small share is held back for a tie or no result in formats where that matters.
Here is how to think about it:
- It is a likelihood, not a verdict. A 70% chance still loses three times in ten. Upsets are part of cricket.
- It describes the current moment. The number reflects the situation right now and shifts as the situation shifts.
- It is built from patterns. Models compare the live situation with how similar situations played out historically, then adjust for the specifics of the match.
- It is relative to the format. A 50-over chase, a T20 chase and a Test session behave very differently, so the same score can mean different things.
The broader category is sometimes called win probability explained for fans, and the core idea is the same across tools: convert a messy, multi-factor situation into a single, readable figure.
What Moves Live Win Probability Ball by Ball
The number changes constantly, but not all events move it equally. The table below shows common triggers and why they matter.
|
Event |
Typical effect |
Why |
|
Wicket of a set batter |
Large swing toward the bowling side |
Resources are lost, and the new batter has to start again |
|
Wicket early in an innings |
Moderate swing |
Plenty of overs and batters remain to recover |
|
Wicket late in an innings |
Often a large swing for the bowling side |
Few overs and batters left to absorb the loss |
|
Boundary or over with a high run count |
Swing toward the batting side |
The required rate falls and the gap closes |
|
Dot balls and tight overs |
Gradual swing toward the bowling side |
Pressure builds as the required rate climbs |
|
Change in conditions or pitch behaviour |
Varies |
Affects how many runs are realistic |
Four inputs sit behind most of these shifts, and they are the same ones fans track by eye:
- Score and target: how many runs are needed, or how big a total has been set.
- Wickets in hand: how many batters remain to score.
- Overs remaining: how much time is left to do it.
- Run rates: the current rate (CRR) against the required rate (RRR) in a chase.
AllCric describes its AI projections as drawing on run rate, wickets, form and pitch conditions. Exact model inputs for win probability are not published in detail, so treat any specific claim about weighting with caution.
How to Read Win Probability Step by Step
Here is a repeatable routine you can use in any match.
- Check the game state first. Note the score, wickets, overs, target and the two run rates. This is your ground truth.
- Look at the headline number. Who is ahead, and by how much? Close to 50/50 means a balanced match. Above 80% or below 20% means one side is well ahead.
- Compare with your own read. Does the number match what you are seeing? If not, work out why. The gap often shows you something you missed, such as a strong tail or a tricky pitch.
- Note the direction of travel. Is the number rising, falling or flat? A steady drift matters more than a single reading.
- Wait for the next key event. After a wicket or a big over, check how far the number moved. Large moves signal turning points.
- Cross-check with other reads. Look at projected score, over and session outlooks and the in-form players to see if they tell the same story.
A Worked Example: Reading a Live Chase
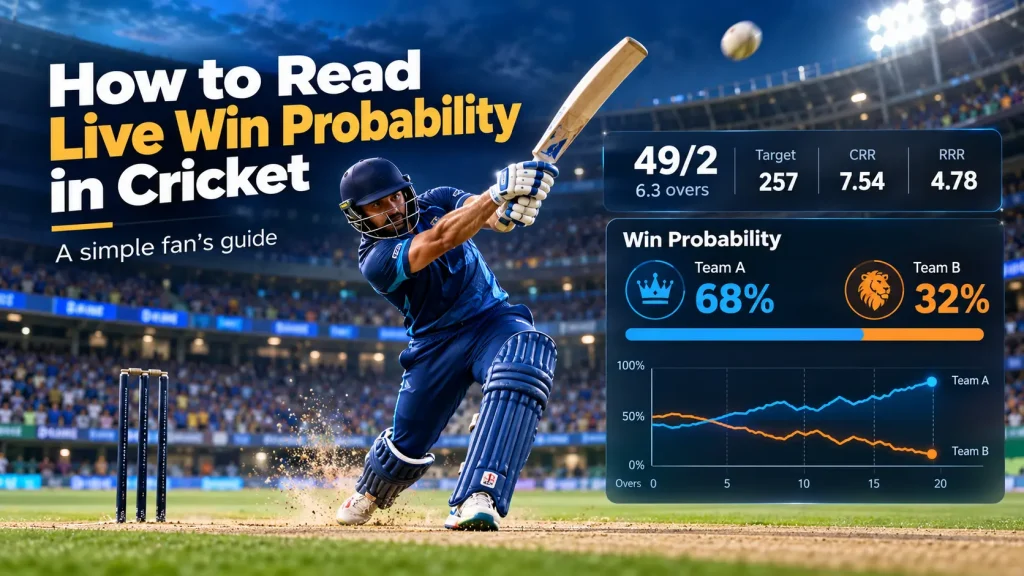
Here is a real situation from AllCric’s AI Signals screen in an ICC CWC League 2 match. Canada were bowled out for 256 in 50 overs. Oman were chasing 257 and stood at 49 for 2 after 6.3 overs.
|
Metric |
Value |
What it tells you |
|
Target |
257 |
Oman need 257 to win |
|
Runs still needed |
208 |
257 minus 49 |
|
Overs left |
43.3 |
50 minus 6.3 |
|
Current run rate (CRR) |
7.54 |
Oman are scoring well above what they need |
|
Required run rate (RRR) |
4.78 |
A comfortable rate for this stage |
|
Wickets in hand |
8 |
Two down, with batting depth still to come |
On the numbers alone, Oman are ahead of the rate. The required rate is well below the current rate, and eight wickets are in hand. A win probability model would likely read this as favourable for the chasing side, though not decisive, since 43 overs remain and wickets can fall in clusters.
Now imagine two wickets fall in the next two overs. The score drops to 58 for 4, the required rate climbs slightly and the batting side loses its top order. Even with the run rate still healthy, wickets in hand are down to six and the number would typically swing back toward the bowling team. This is why the two quantities, run rate and wickets, must be read together.
This worked example is illustrative of how to reason about the situation. The exact win probability value in the app depends on the model.
Reading the Shape of the Probability Curve
A single number is useful. A curve is better. If you can see how the probability has moved over the course of an innings, you can read the story of the match.
- Steady climb: the favoured team is controlling the game and building a margin.
- Sharp drop after a wicket: a turning point. Look at who was dismissed and when.
- See-saw pattern: a contest with swings both ways, often in tight chases.
- Flat line near 50%: an evenly balanced match where the next big over decides it.
- Slow fade: pressure is building through dot balls and rising required rates, often without a single dramatic moment.
The habit worth building is to watch the trend rather than a single reading. A single irregular over rarely breaks a pattern, and AllCric’s own guidance for its over-level signals makes the same point.
Win Probability and AllCric AI Signals
AllCric’s AI Signals tab sits alongside the Live, Scorecard, Commentary and Fantasy tabs for each match. The match header stays visible at the top with the score, overs, CRR, RRR and target, so you can read signals against the live situation. AllCric’s published materials list AI Win Probability as part of its AI Markets, alongside Predicted Score Range, Over Prediction, Session Prediction and Top Player Impact.
These modules complement each other:
- AI Predicted Score: a projected innings score based on run rate and wickets. In the example match, the card showed a projection of 262.0 runs against a target of 257.
- AI Over Prediction: an over-level read based on form and pitch conditions, with an AI confidence percentage.
- AI Session Prediction: a projected session score displayed against the actual score.
- AI Top Player: the top three batters and bowlers by recent form, with confidence bars.
Each module has an information icon that explains what it means, how to use it, strategy tips and a pro tip, and each shows an update time so you can judge how fresh the read is. Reading win probability next to these modules gives you a fuller picture. If the projected score is above the target and the win probability favours the chasing side, the signals agree. If they diverge, that is a prompt to look closer.
You can also use the Ask AI bar at the bottom of the screen to ask match-specific questions in plain language, such as why a team is favoured at this stage or how the required rate compares with the current rate. Some AI Signals data appears behind a subscription prompt in the app, so check what is available to you on the in-app screen.
Common Mistakes When Reading Win Probability
- Treating a high number as a guarantee. Even 85% means the other side wins about one time in seven.
- Ignoring the format. A T20 swing can reverse in an over. A 50-over chase usually has more time to recover.
- Reacting to a single reading. One over can move the number sharply. Look at the trend.
- Looking only at run rate. A healthy rate with falling wickets is weaker than it looks.
- Forgetting who is still to bat. A model can account for batters in hand, but you should know whether the tail is strong or weak.
- Ignoring freshness. Check the update time. A stale reading can mislead during a fast passage of play.
- Using it as a substitute for judgement. It is one input alongside your own knowledge of the teams, pitch and conditions.
Win Probability vs Betting Odds: An Important Difference
Searches for terms like ball by ball odds often mix up two different things. Win probability is a statistical estimate of how a match may unfold. Betting odds are prices set by bookmakers that include margins and reflect market demand.
|
Win probability |
Betting odds |
|
|
What it is |
A model’s estimate of each team’s chance |
A price set by a bookmaker |
|
Purpose |
Understanding the match |
Setting terms for a wager |
|
Includes a margin |
No |
Yes |
AllCric presents its AI Signals as insights and probabilities for fans and skill-based fantasy players, not as a betting product. Use the figures to understand the match better, and play within limits you are comfortable with.
Final Thoughts: Read the Number, Then Read the Game
The best way to use live win probability cricket tools is as a second opinion. The number compresses a lot of context into a single figure, which makes it quick to scan and easy to compare with what you are watching. But it works best alongside the scorecard, the run rates, the wickets in hand and your own sense of the game.
Start with the match state, read the number, watch the trend and look closely at the moments where it moves. Open the AI Signals tab in your next live match, compare the signals with what the scoreboard shows and see how often they agree. That is how to read win probability, and how to stay one ball ahead.
FAQS
It is an estimate of each team’s chance of winning at the current moment, updated as the match unfolds.
Check the game state, look at the headline percentage, note the direction of travel and compare it with your own read. Treat large swings after wickets or big overs as turning points.
No. It means they win more often than not in similar situations. Upsets happen.
Because fewer overs and wickets mean each event carries more weight.
AllCric’s published materials list AI Win Probability among its AI Markets. Availability and access levels can vary by match and plan, so check the app.
You can use Ask AI to ask match-specific questions in plain language, such as how the current and required run rates compare.